Why 2027 Is a Pivotal Year for SA Buy-to-Let Investors
South Africa's property market is entering a structural inflection point. After years of aggressive interest rate hikes that peaked at a repo rate of 8.25% in 2024, the SARB embarked on an easing cycle, cutting rates six consecutive times. However, on 28 May 2026 the MPC reversed course, hiking the repo rate by 25bp to 7.00% with prime then at 10.50%, citing intensifying inflation risks; the MPC hiked again by 25bp on 23 September 2026, taking the repo rate to 7.25% and prime to 10.75%. Analysts continue to project a return to cuts once inflation stabilises, with some forecasting the repo ending 2027 at 5.75%, but the timing is now less certain.
GDP growth accelerating from 0.5% in 2024 to a projected 1.8% in 2027, combined with a potential future return to rate cuts once inflation stabilises, could create a favourable convergence of conditions for buy-to-let investors:
- Potentially cheaper debt servicing if cuts resume: would lift cash-on-cash returns on leveraged properties
- Inflation easing towards target: CPI was 4.4% in August 2026 (Stats SA), above the top of SARB's new tolerance band around its 3% target, so a move back towards the target would make rental escalations more predictable
- Improving tenant affordability: lower arrears and vacancy risk as household budgets ease
- Infrastructure investment in energy, water and transport: property value support across key nodes
For investors asking "Where should I buy rental property in South Africa in 2027?", this article delivers a data-driven, city-by-city projection using rental yield data, macroeconomic forecasts, vacancy rates, tenant demand drivers, tax implications and infrastructure pipelines.
Methodology: How We Built These Projections
Our projections integrate five data layers:
1. Current Rental Yield Data (2026 Baseline)
Net yields come from our own suburb-level model at the time of writing (see the methodology note below), after deducting an 8% vacancy allowance, a 9% management fee, municipal rates and taxes, maintenance (1–2% of property value annually), and insurance and levies. The vacancy, fee and maintenance figures are our assumptions for this article, not published market averages.
2. Macroeconomic Forecasts
- SARB repo rate: 7.25% (23 September 2026, a further 25bp hike from the 7.00% set in May 2026), further path uncertain; analyst consensus ~5.75% by end-2027 if inflation stabilises
- GDP growth: 1.6% (2026) → 1.8% (2027) → 2.0% (2028)
- CPI inflation: 4.4% in August 2026 (Stats SA), above the top of SARB's new tolerance band around its 3% target; the 2027 path is uncertain
- National unemployment: 31.9% (improving slowly)
3. Rental Market Dynamics
- National average rent: R9,132/month (2026)
- Western Cape average: R11,285/month (highest nationally)
- Gauteng average: R9,169/month | KZN average: R9,170/month
- Tenant arrears: 17.2% in Q3 2025, elevated but stabilising
4. Supply and Demand Indicators
- Cape Town vacancy rate: 1.07% (2024), lowest on record
- Johannesburg vacancy: 7–8% average, higher but stable
- Foreign buyer activity: Over R1 billion in Cape Town premium areas (Jan–May 2025)
5. Tax and Regulatory Environment
- Personal income tax threshold: R99,000 (2026/27)
- CGT annual exclusion: R50,000
- Primary residence CGT exclusion: R3 million
Top 10 Rental Yield Areas for 2027, Quick Summary
2027 Net Yield Rankings, Top 10 Areas
| Rank | City / Area | 2026 Net Yield | 2027 Projected | Entry Price |
|---|---|---|---|---|
| 1 | Centurion (Pretoria) | 12.5% | 13.0% | R620,000 |
| 2 | Fourways (Johannesburg) | 11.4% | 11.9% | R750,000 |
| 3 | Sandton (Johannesburg) | 11.0% | 11.5% | R900,000 |
| 4 | Observatory (Cape Town) | 11.4% | 11.8% | R920,000 |
| 5 | Rosebank (Johannesburg) | 10.2% | 10.7% | R1,150,000 |
| 6 | Woodstock (Cape Town) | 10.2% | 10.6% | R1,050,000 |
| 7 | Hatfield (Pretoria) | 9.9% | 10.4% | R650,000 |
| 8 | Menlyn (Pretoria) | 9.8% | 10.3% | R850,000 |
| 9 | Bryanston (Johannesburg), 2-Bed | 9.7% | 10.2% | R1,750,000 |
| 10 | Bellville (Cape Town) | 7.6% | 8.1% | R820,000 |
Ranked by projected net yield within unit type: Bryanston's figures are for a 2-bedroom unit (its 1-bedroom stock is thinner locally); every other row is a 1-bedroom apartment. Yields are not directly comparable across unit types; see the Property Type Strategy section below.
Methodology: the 2026 Net Yield column is SA Property Tools' own suburb-level analysis; no external provider publishes net (post-cost), 1-bedroom-specific yields at this granularity, unlike our national and city-level gross yield figures, which are sourced directly to Global Property Guide and TPN (see citations throughout this article). The 2027 Projected column is our own forward estimate built on that analysis, not a claim attributed to any external source. Treat both as informed analyst estimates for comparison purposes, not verified market data; always confirm suburb-level numbers against current listings before making an investment decision.
Key Data Visualisations
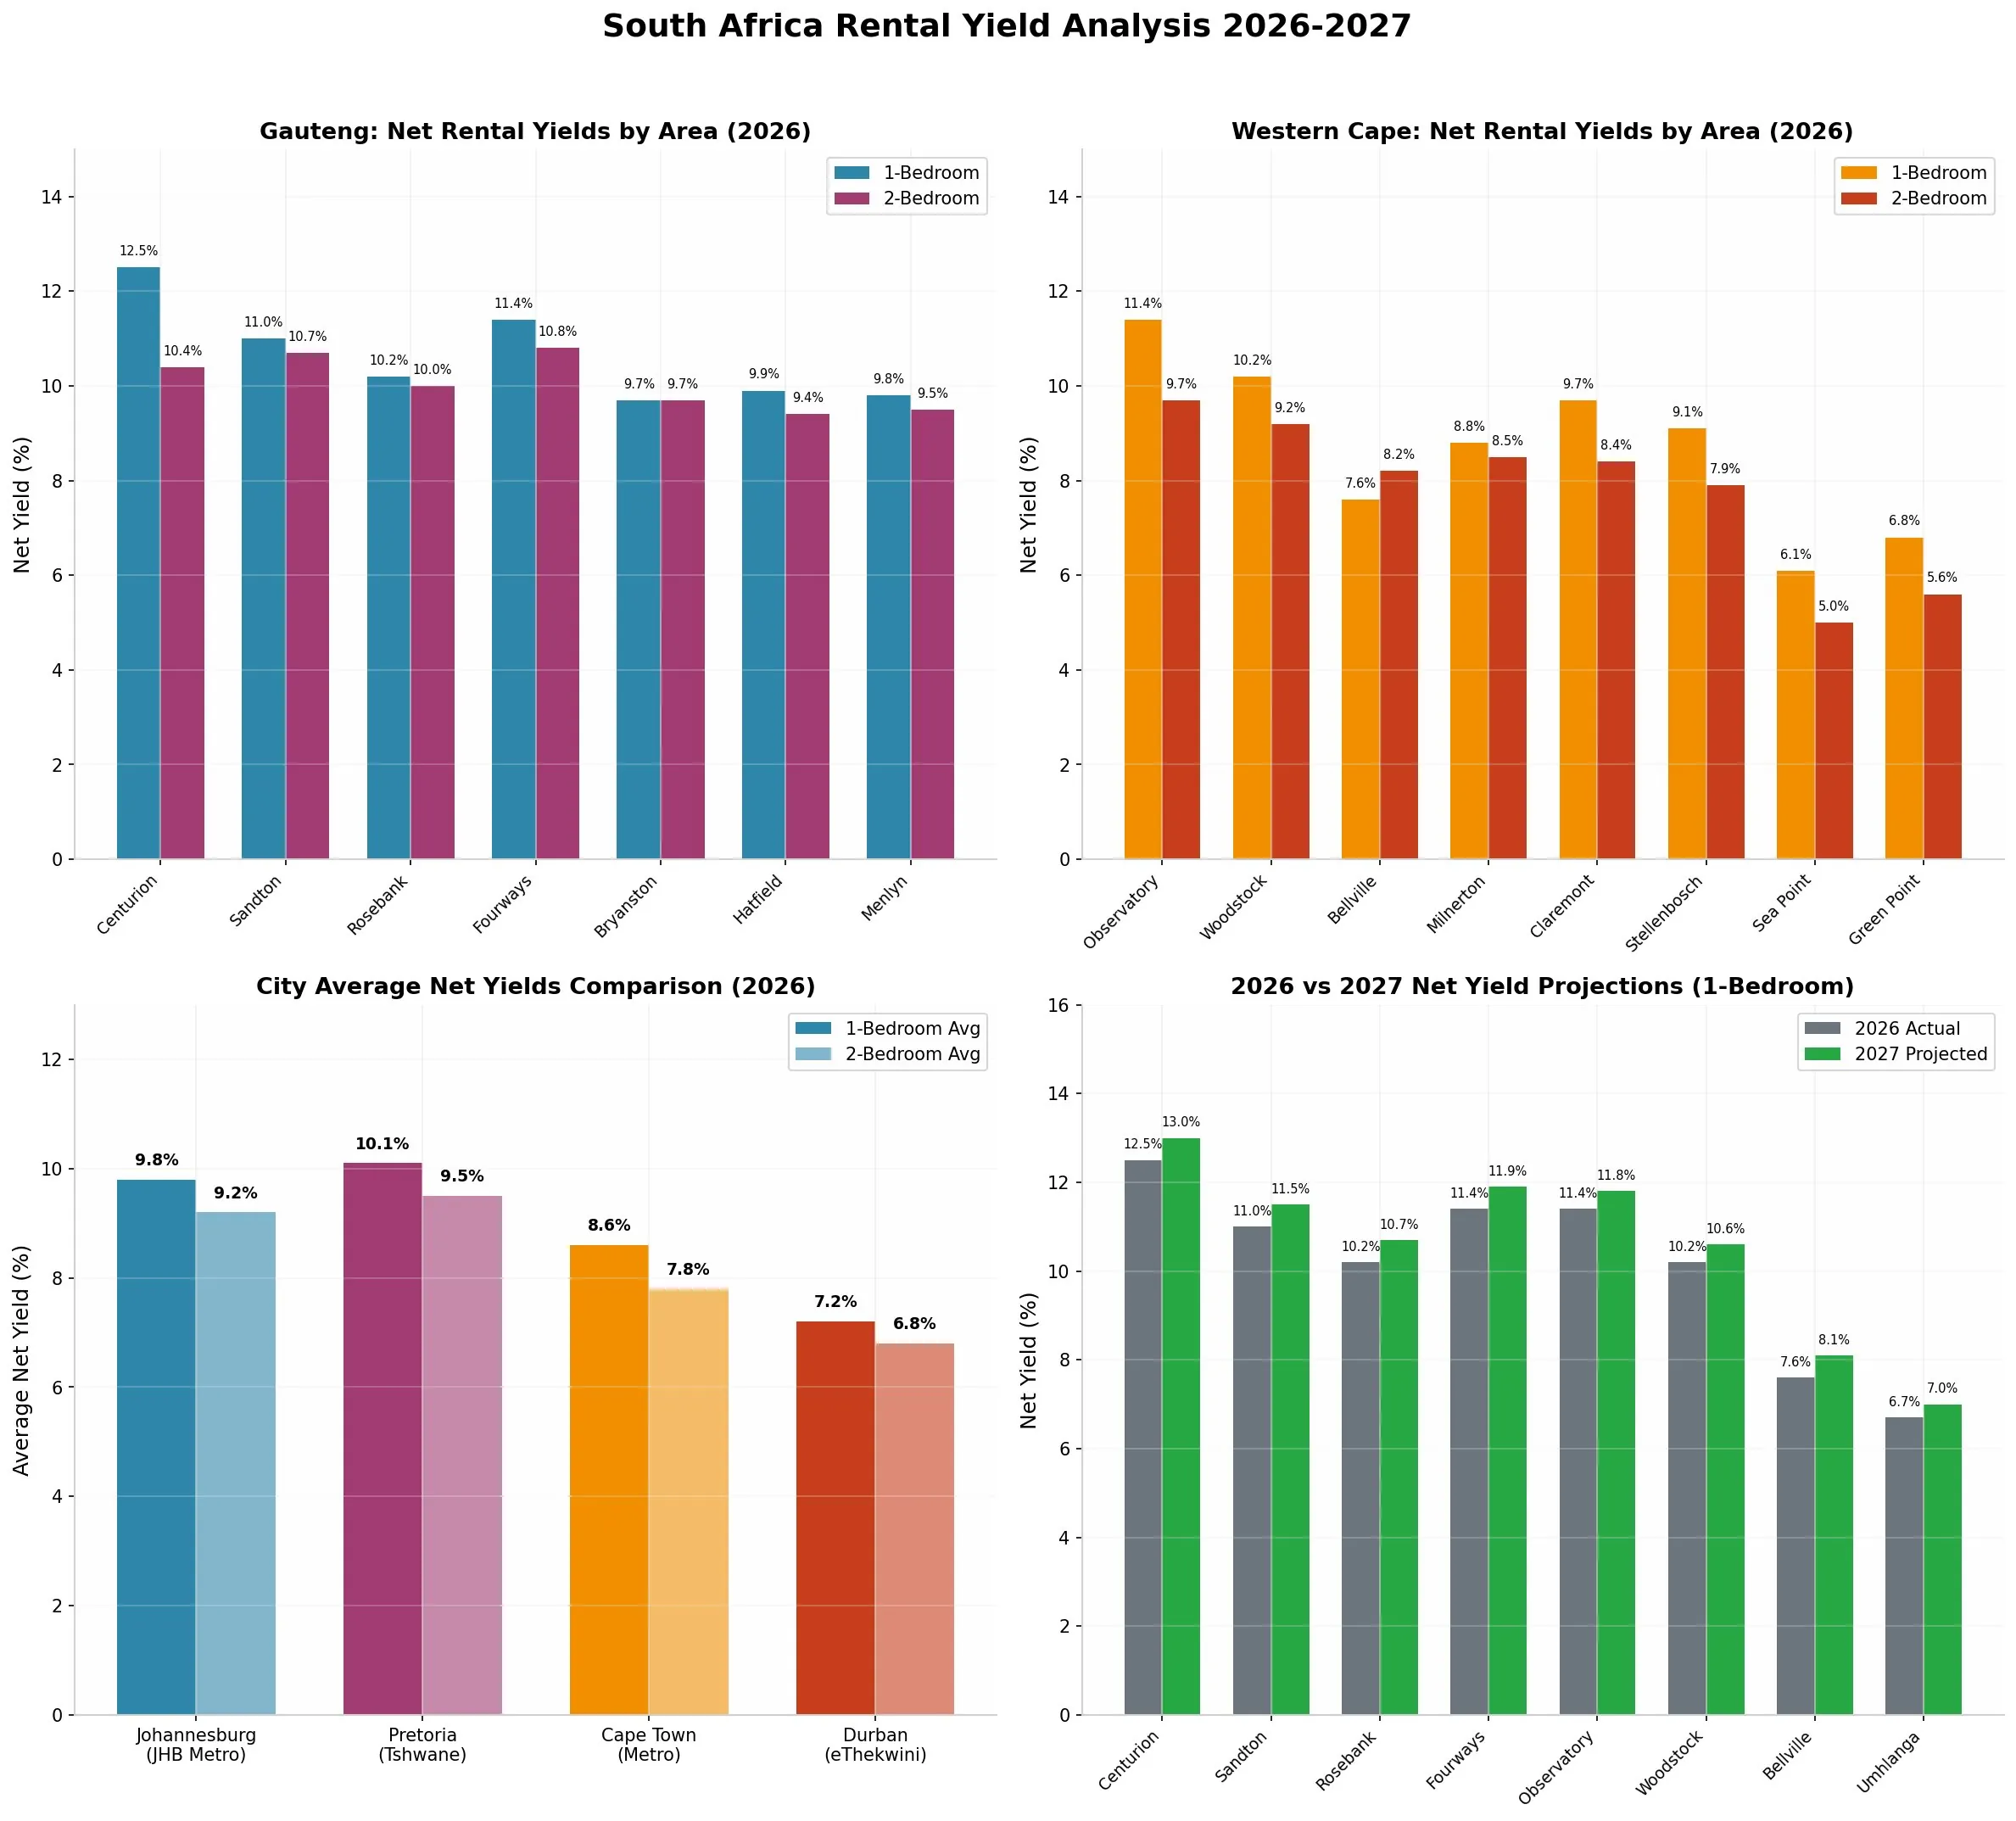
Figure 1: SA Rental Yield Analysis 2026–2027, net yields by area for Gauteng and Western Cape, city average comparison, and 2027 projected yields
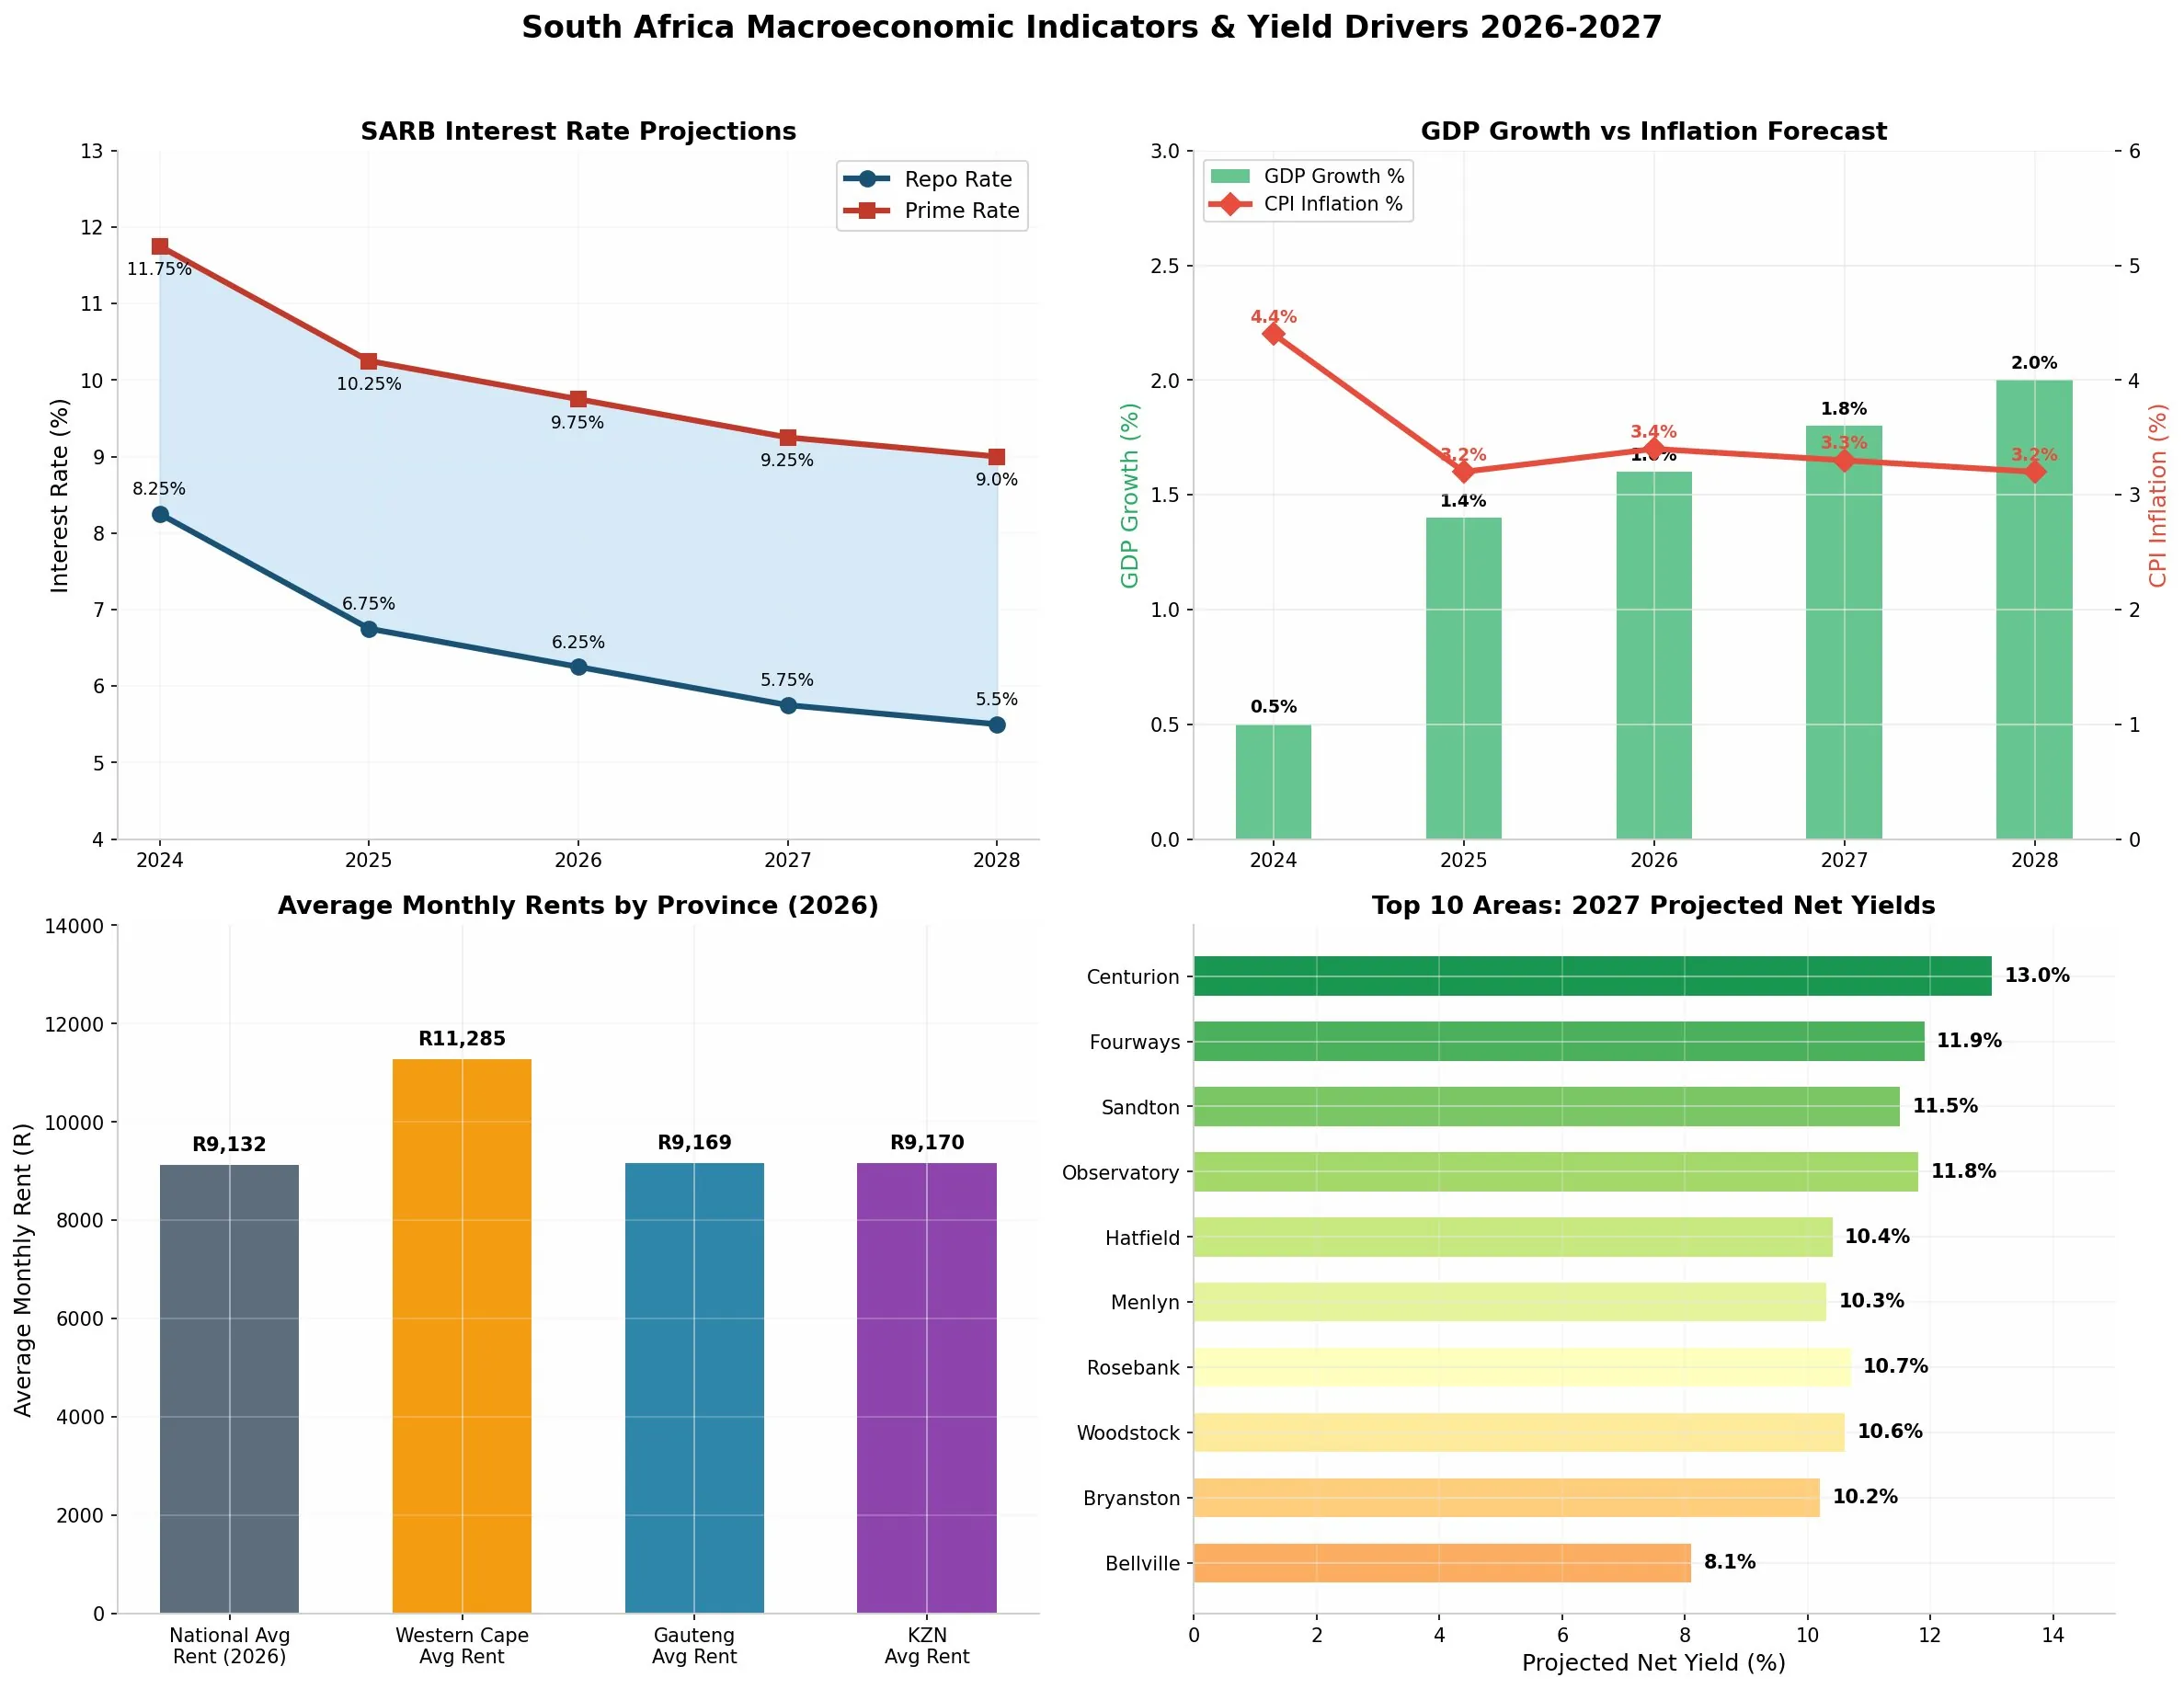
Figure 2: Macroeconomic Indicators and Yield Drivers, SARB rate trajectory, GDP vs inflation, average rents by province, and top 10 2027 net yield projections
See where your number lands. Enter your property's price and rent to get its exact net yield and compare it to the city rankings above.
Rental Yield Calculator →City-by-City 2027 Rental Yield Projections
🥇 1. Pretoria (Tshwane), The Yield Capital of South Africa
2026 City Avg: 10.1% | 2027 Projected: 10.6%Pretoria emerges as South Africa's undisputed yield champion in 2027, driven by two powerhouse nodes and the lowest entry prices among major yield areas.
Centurion, The Standout
| Metric | 2026 | 2027 Projection |
|---|---|---|
| 1-Bed Purchase Price | R620,000 | R645,000 |
| 1-Bed Monthly Rent | R7,600 | R8,100 |
| Gross Yield | 14.7% | 15.1% |
| Net Yield | 12.5% | 13.0% |
Why Centurion dominates: Lowest entry price among major yield areas, with Menlyn Maine and Centurion Mall driving sustained tenant demand. Proximity to Gautrain, N1/N14 highways, and the Waterfall City spillover effect. Strong tenant base of young professionals and students from the University of Pretoria and Tshwane University of Technology. Lower body corporate levies than Sandton or Rosebank.
Hatfield, Student Rental Powerhouse
| Metric | 2026 | 2027 Projection |
|---|---|---|
| 1-Bed Purchase Price | R650,000 | R675,000 |
| 1-Bed Monthly Rent | R6,800 | R7,300 |
| Net Yield | 9.9% | 10.4% |
Hatfield benefits from virtually guaranteed demand from the University of Pretoria and embassies in the diplomatic quarter. Vacancy is structurally low. The Gautrain station adds a second tenant demographic of CBD commuters who prefer to avoid Pretoria CBD crime risks.
Menlyn, New Development Hub
| Metric | 2026 | 2027 Projection |
|---|---|---|
| 1-Bed Purchase Price | R850,000 | R885,000 |
| 1-Bed Monthly Rent | R8,700 | R9,300 |
| Net Yield | 9.8% | 10.3% |
🥈 2. Johannesburg, Yield Meets Liquidity
2026 City Avg: 9.8% | 2027 Projected: 10.3%Johannesburg offers the best combination of high yield and investment liquidity in South Africa. The city's depth of tenant demand, from corporate relocations, young professionals and the service sector, means well-located properties rarely sit vacant.
Fourways, The High-Yield Surprise
| Metric | 2026 | 2027 Projection |
|---|---|---|
| 1-Bed Purchase Price | R750,000 | R780,000 |
| 1-Bed Monthly Rent | R8,500 | R9,100 |
| Net Yield | 11.4% | 11.9% |
Fourways punches well above its weight for yield. The Fourways Mall precinct, Montecasino, and corporate campuses generate consistent professional tenant demand while prices remain accessible relative to Sandton.
Sandton, Blue-Chip Yield
| Metric | 2026 | 2027 Projection |
|---|---|---|
| 1-Bed Purchase Price | R900,000 | R940,000 |
| 1-Bed Monthly Rent | R10,300 | R11,000 |
| Net Yield | 11.0% | 11.5% |
Rosebank, Premium Yield
| Metric | 2026 | 2027 Projection |
|---|---|---|
| 1-Bed Purchase Price | R1,150,000 | R1,200,000 |
| 1-Bed Monthly Rent | R12,200 | R13,000 |
| Net Yield | 10.2% | 10.7% |
Bryanston, Best 2-Bedroom Value
| Metric | 2026 | 2027 Projection |
|---|---|---|
| 2-Bed Purchase Price | R1,750,000 | R1,820,000 |
| 2-Bed Monthly Rent | R17,800 | R19,000 |
| Net Yield | 9.7% | 10.2% |
Johannesburg 2027 Outlook: Rate cuts stimulate demand from first-time tenants upgrading from shared accommodation. Corporate office market recovery drives Sandton and Rosebank. Midrand and Waterfall City infrastructure investment adds a new high-yield corridor to monitor.
Modelling at current rates? Calculate your exact monthly repayment at prime 10.75%, and see how the projected 2027 rate path changes your cash flow.
Bond Repayment Calculator →🏅 3. Cape Town, Stability, Growth and Selective Yield
2026 City Avg: 8.6% | 2027 Projected: 9.0%Cape Town defies the conventional wisdom that lower yields mean worse investments. With the lowest vacancy rate in the country (1.07%), strong foreign buyer demand, and consistent semigration from Gauteng and KZN, Cape Town offers something Johannesburg and Pretoria cannot: price resilience and capital growth certainty.
Observatory, Cape Town's Yield Leader
| Metric | 2026 | 2027 Projection |
|---|---|---|
| 1-Bed Purchase Price | R920,000 | R960,000 |
| 1-Bed Monthly Rent | R10,900 | R11,700 |
| Net Yield | 11.4% | 11.8% |
Observatory offers Cape Town's strongest yield due to proximity to UCT, Groote Schuur Hospital, the CBD, and the emerging creative and tech sector. Building and complex selection is critical, established complexes outperform individual units significantly.
Woodstock, Creative Economy Hub
| Metric | 2026 | 2027 Projection |
|---|---|---|
| 1-Bed Purchase Price | R1,050,000 | R1,095,000 |
| 1-Bed Monthly Rent | R11,000 | R11,700 |
| Net Yield | 10.2% | 10.6% |
Woodstock's gentrification trajectory and creative-sector tenant base support strong rents. Security and building quality due diligence is essential, the gap between well-managed and poorly-managed stock is wider here than in most suburbs.
Sea Point and Green Point, Lifestyle, Not Yield
| Area | 2026 Net Yield | 2027 Projection | Strategy |
|---|---|---|---|
| Sea Point (1-Bed) | 6.1% | 6.4% | Capital preservation |
| Green Point (1-Bed) | 6.8% | 7.1% | Capital preservation |
These areas are capital preservation plays, foreign buyers committed over R1 billion here in early 2025. Yields are modest but capital growth and liquidity are the highest in the country.
4. Durban (eThekwini), The Recovery Story
2026 City Avg: 7.2% | 2027 Projected: 7.6%Durban offers attractive gross yields (8–10% in northern suburbs) but higher operating costs and vacancy risk compress net returns below those of Johannesburg and Pretoria. The recovery from the 2021 July unrest and ongoing municipal service delivery challenges continue to weigh on investor confidence, though improving sentiment is visible.
Durban North and Glenwood
| Metric | 2026 | 2027 Projection |
|---|---|---|
| Gross Yield Range | 8–10% | 8.5–10.5% |
| Net Yield (Est.) | 5.5–7% | 6–7.6% |
Westville, Hillcrest and Waterfall, The Steady Middle
| Metric | 2026 | 2027 Projection |
|---|---|---|
| Gross Yield Range | 7–9.5% | 7.5–10% |
| Net Yield (Est.) | 5.5–7.5% | 6–8% |
Established suburban markets with school-driven family demand and lower turnover than the inner-city nodes. Westville is particularly consistent, a decade of reliable buy-to-let performance at moderate entry prices and manageable risk. Hillcrest benefits from the Outer West growth corridor and proximity to sought-after schools; Waterfall's continued commercial and residential development supports both rental demand and capital growth.
Berea, Glenwood and Morningside, Highest Yield, Highest Management Intensity
| Metric | 2026 | 2027 Projection |
|---|---|---|
| Gross Yield Range | 9–14% | 9.5–14.5% |
| Net Yield (Est.) | 7–11% | 7.5–11.5% |
Durban's highest-yielding node, boosted by strong student and young-professional rental demand. Cash flow positive at lower deposit levels than any other Durban area, but with the greatest management intensity on this list. Body corporate health is the key variable in sectional-title stock here, assess it carefully before purchasing, since a poorly-run building can erode the yield advantage quickly.
Umhlanga, Premium Coastal
| Metric | 2026 | 2027 Projection |
|---|---|---|
| 1-Bed Purchase Price | R1,230,000 | R1,280,000 |
| 1-Bed Monthly Rent | R9,000 | R9,400 |
| Net Yield | 6.7% | 7.0% |
Umhlanga is stable but yield-compressed, better suited to investors prioritising lifestyle, capital growth and tenant stability over maximum cash flow.
The 2027 Yield Equation: 5 Forces Driving Projections
1. Interest Rate Trajectory, The Strongest Driver
A projected return to an easing cycle is the single biggest potential tailwind for 2027 yields, though the September 2026 hike means this is not guaranteed. Every 25bps rate cut, if and when it comes, would reduce bond servicing costs by approximately R150–R300 per month on typical buy-to-let properties, improve cash-on-cash returns by 0.3–0.5 percentage points and expand the buyer pool, supporting property values without compressing rents.
Projection: Repo rate falling from its current 7.25% to 5.75% by end-2027 adds approximately 0.5–0.8 percentage points to net yields on leveraged properties across all markets.
2. Inflation and Rental Escalations
CPI was 4.4% in August 2026 (Stats SA), above the top of the tolerance band around SARB's new 3% target. Published rental growth is about 5%: MRI TPN forecasts 4.5% to 5.5% for 2026 and the PayProp Rental Index showed 5.2% year on year in Q2 2026. Rental escalations in that range are in line with the market, but they only just outpace inflation today. If CPI falls back towards the target, real returns improve; at current inflation they stay thin.
3. Infrastructure and Development
- Waterfall City, R100bn project, 28,000 units by 2027, creating a new high-demand node
- Gautrain expansion to Soweto and Pretoria west, new transport corridors drive rental demand
- Renewable energy rollout reducing load shedding frequency and severity
- Road upgrades (N1, N3, N2) improving commuter access to key rental nodes
4. Tenant Affordability
Disposable income after rent and debt payments fell to 20.9% in 2025. As interest rates decline and real wages recover, tenant affordability improves, meaning lower arrears, shorter vacancy periods and more stable yields for landlords across all tiers.
5. Tax Efficiency
The 2026 Budget introduced several pro-investor changes: higher personal income tax threshold (R99,000), increased CGT exclusions (R50,000 annual, R3m primary residence). Small portfolios generating rental income below R99,000 net may pay zero tax, making buy-to-let highly tax-efficient at the entry level.
Property Type Strategy: What to Buy in 2027
| Property Type | Avg Net Yield | Tenant Depth | Maintenance Risk | Liquidity |
|---|---|---|---|---|
| 1-Bed Apartment | 10.5% | Medium | Low | High |
| 2-Bed Apartment | 9.8% | High | Low | High |
| 3-Bed House | 7.5% | Medium | High | Medium |
| Studio | 11.0% | Low | Low | Medium |
Our recommendation: 2-bedroom sectional-title units in secure, well-managed complexes offer the best risk-adjusted yield. They attract a broader tenant pool, couples, sharers, small families and remote workers, with manageable levies and lower maintenance risk than freehold houses.
What to avoid in 2027:
- 3-bedroom freehold houses in premium suburbs (Parkhurst, Houghton, Sea Point), yields drop to 3.6–5.5% net
- Oversupplied CBD buildings with poor sectional title management or high special levy risk
- Student-only properties without professional tenant management backup
Tax Considerations for 2027 Buy-to-Let Investors
For South African Residents
Rental income is taxable, but deductible expenses reduce the effective tax burden significantly. Deductible items include:
- Bond interest (full amount deductible against rental income)
- Municipal rates and body corporate levies
- Insurance and maintenance costs
- Agent management fees (typically 8–10%)
- Depreciation on fixtures and fittings
The personal income tax threshold of R99,000 (under 65) means small portfolios may effectively pay zero tax after deductions, making entry-level buy-to-let highly efficient.
For Foreign Investors
- Taxed only on South African-sourced income
- Non-resident CGT withholding: 7.5% for individuals, 10% for companies
- Must register with SARS as a non-resident taxpayer before receiving rental income
- Primary residence CGT exclusion (R3m) may apply in limited circumstances, professional advice is essential
Risk Factors That Could Derail 2027 Projections
| Risk | Probability | Yield Impact |
|---|---|---|
| SARB delays the projected return to rate cuts due to oil or FX shocks | Medium | −0.5 to −1.0% |
| Municipal service collapse (water/electricity) | Medium-High (regional) | −1.0 to −2.0% |
| Recession (GDP below 1%) | Low | −0.8 to −1.5% |
| Oversupply in specific nodes (Waterfall, Midrand) | Medium | −0.3 to −0.8% |
| Tenant arrears spike above 20% nationally | Medium | −0.5 to −1.0% |
| New property taxes or levies introduced | Low | −0.2 to −0.5% |
Conclusion: Your 2027 Buy-to-Let Action Plan
South Africa's rental market in 2027 presents a potential alignment of an eventual return to monetary easing, economic recovery, and yield opportunity, though the September 2026 hike means that easing leg is not yet confirmed. Here is the strategic roadmap based on the data:
- Target Pretoria (Centurion, Hatfield, Menlyn) for maximum yield, 10.4–13.0% net
- Target Johannesburg (Fourways, Sandton, Rosebank, Bryanston) for yield combined with liquidity, 10.2–11.9% net
- Target Cape Town (Observatory, Woodstock) for yield and capital growth balance, 10.6–11.8% net
- Buy 2-bedroom sectional-title units in well-managed, secure complexes for optimal risk-adjusted returns
- Calculate net yield, not gross yield, using your actual bond repayment, rates, levies and vacancy assumptions before any purchase
- Monitor the macro indicators, repo rate, CPI and GDP growth will move the market; quarterly recalibration is worth the effort
The data does not lie: Centurion at 13% net, Fourways at 11.9%, Observatory at 11.8%, these are compelling numbers in any investment context. Use them as starting points for your own due diligence, not as guarantees.
🚀 Calculate Your Specific Property's Numbers
Every property is different. Use our free calculators to run the numbers on any property with your actual purchase price, bond repayment, rates, levies and vacancy assumptions.
Ready to Finance Your Next Investment Property?
Bond originators compare multiple banks simultaneously, and it costs you nothing. SA's most established originators:
Apply via BetterBond (free) →Affiliate disclosure: we may receive a referral fee if you apply through these links, at no cost to you.
⚠️ Disclaimer: This article is for informational purposes only and does not constitute financial advice. Rental yields are projections based on current data and macroeconomic forecasts. Actual returns may vary. Always conduct independent due diligence and consult a qualified financial advisor before making investment decisions.
Frequently Asked Questions
Rental yield measures the annual rental income a property generates as a percentage of its purchase price. Gross yield is before expenses; net yield deducts all operating costs. A net yield above 8% is generally considered strong in South Africa. Use our Rental Yield Calculator to calculate any property's actual yield with your specific numbers.
Pretoria (Tshwane), specifically Centurion, projects the highest net yield at 13.0% for 1-bedroom apartments. Hatfield (10.4%) and Menlyn (10.3%) also rank in the national top 10. Johannesburg's Fourways (11.9%) and Sandton (11.5%) are the strongest performers outside Pretoria. These are net yields, after an 8% vacancy allowance, a 9% management fee, rates, maintenance, insurance and levies.
Not at all. Cape Town trades yield for capital growth and stability. With a 1.07% vacancy rate and strong foreign demand, Cape Town properties appreciate faster and sell quicker. Observatory (11.8%) and Woodstock (10.6%) are exceptions, competitive yield plus Cape Town stability. Cape Town is ideal for investors prioritising wealth preservation alongside income.
2-bedroom units offer the best risk-adjusted balance. While 1-bedrooms often show higher headline yields, 2-bedrooms attract broader tenant demand (couples, sharers, small families, remote workers), carry lower vacancy risk, have better resale liquidity and typically yield only 0.5–1.0% less. For most investors, 2-bedroom sectional-title in a secure complex is the optimal starting point.
If the SARB resumes its rate-cutting cycle, which analysts project once inflation stabilises, lower rates improve yields in two ways: reduced bond servicing costs increase net cash flow, and improved tenant affordability reduces arrears and vacancy. The analyst consensus scenario of a return toward 5.75% repo by end-2027 could add 0.5–0.8 percentage points to net yields. However, the May 2026 hike to 7.00%, followed by a further hike to 7.25% on 23 September 2026, means investors should model at current rates and treat cuts as potential upside rather than a baseline assumption.
The five biggest risks are: (1) Municipal service delivery failures, water and electricity issues in specific areas can drive tenants away; (2) Tenant arrears, currently 17.2% nationally and elevated; (3) Body corporate mismanagement, special levies can destroy yields unexpectedly; (4) Oversupply in new development nodes; and (5) Interest rate volatility if global inflation surprises upward. The mitigation is thorough due diligence before purchase, not after.
Yes, areas like Soweto and parts of the East Rand can show gross yields of 12–15%. However, these come with higher management intensity, more rigorous tenant screening requirements, lower liquidity and capital growth and infrastructure challenges that affect vacancy. These investments are best suited to experienced investors with established local management networks.
Yes, if you buy right. A projected pick-up in GDP growth supports a favourable entry window, and a potential future return to rate cuts would add further upside, though the September 2026 hike means that isn't guaranteed. Properties bought at the right price in the right node now should benefit from capital growth as the market recovers, with any rate cuts an additional tailwind rather than the baseline case. The investors who act with data-driven precision in 2027 will capture yields that may not be available once the full recovery is priced in.
Deductible expenses include bond interest, municipal rates, body corporate levies, insurance, repairs and maintenance, agent management fees, advertising costs and depreciation on furniture and fittings. SARS audits rental properties regularly, keep meticulous records. Always confirm your specific deductions with a registered tax practitioner.